Ontrack delivery metrics

Whether your ingest data from your pipelines in Jenkins or GitHub Actions, Ontrack will collect information like validations and promotions for each of your builds, for all your branches, pull requests and repositories.
Using the main view at branch level:
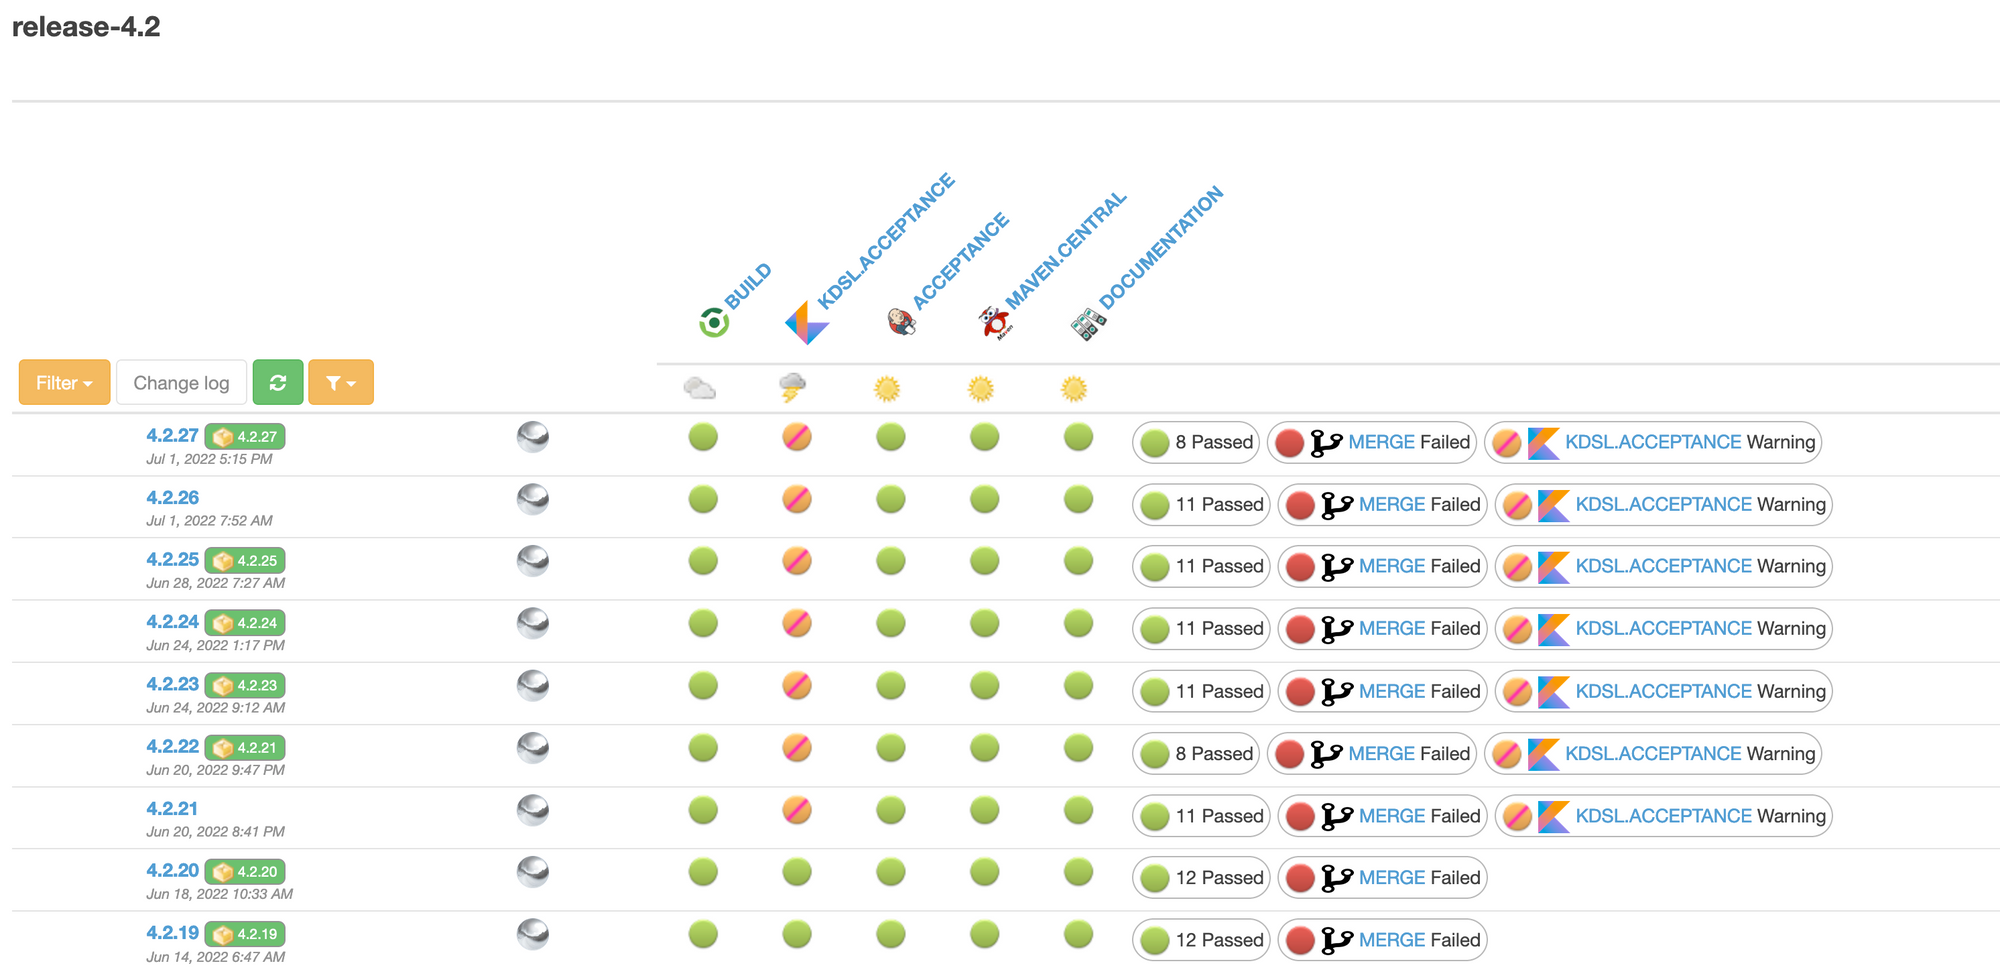
You can quickly check the health of your pipeline. But you might want to get more out of this:
- how frequent are your promotions?
- how long does it take to get a given validation?
- if a promotion is not granted following an error, how long does it take to get it back?
- etc.
This kind of information allows you to get insights on the speed and stability of your pipelines. By plotting this along the time axis, you can check the long term effects of your corrections and optimizations.
So. How to get this from Ontrack? It's just one click away!
To get delivery metrics at promotion level, just click on the promotion in the branch page:
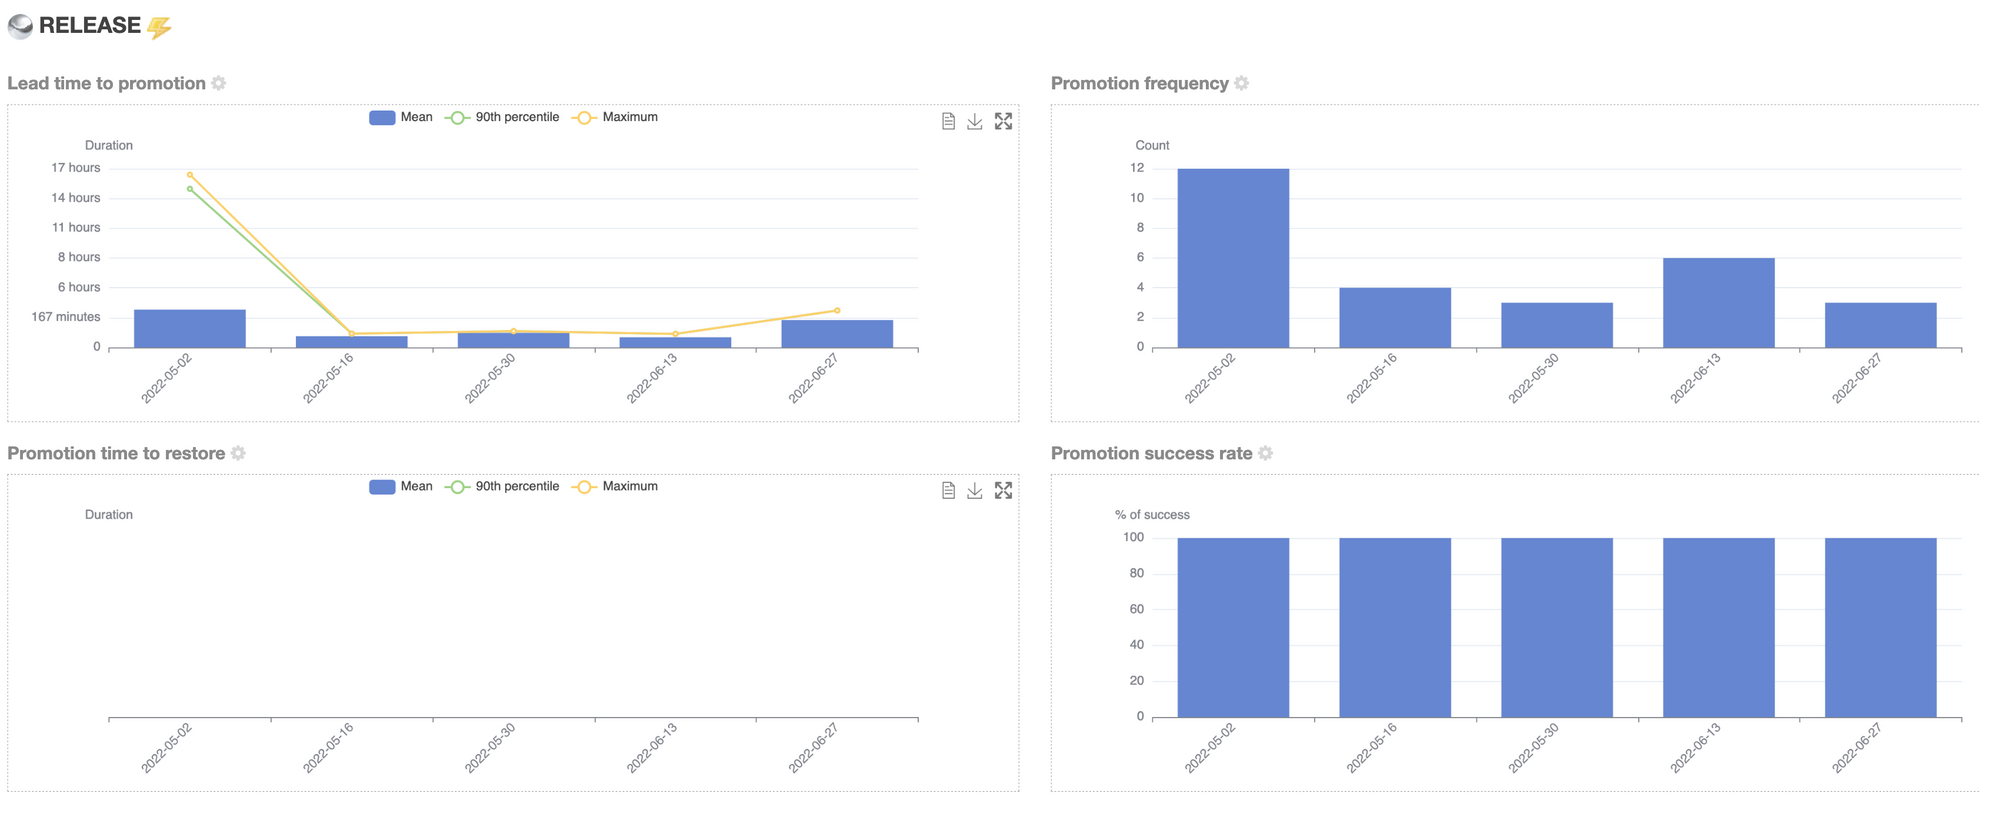
Four graphs, four indicators:
- lead time to promotion - how long does it take for a given build to be promoted? That's a precious speed indicator, showing how long does it take to be ready for delivery
- promotion frequency - for a given period of time, how many times this promotion was granted?
- promotion time to restore - when a promotion is failed, not granted actually, how long does it take to restore it? It's an indicator about the ease with which you can identify and fix delivery errors
- promotion success rate - this stability indicator shows the percentage of candidate builds which reach the promotion level.
Do these metrics sound like the ones in the Accelerate book? That's because they are. By mapping your promotions to different stages of your delivery, you can quickly get an overview of the performance of it.
As for the validation stamps, that's the same thing: just click on them in the branch page:
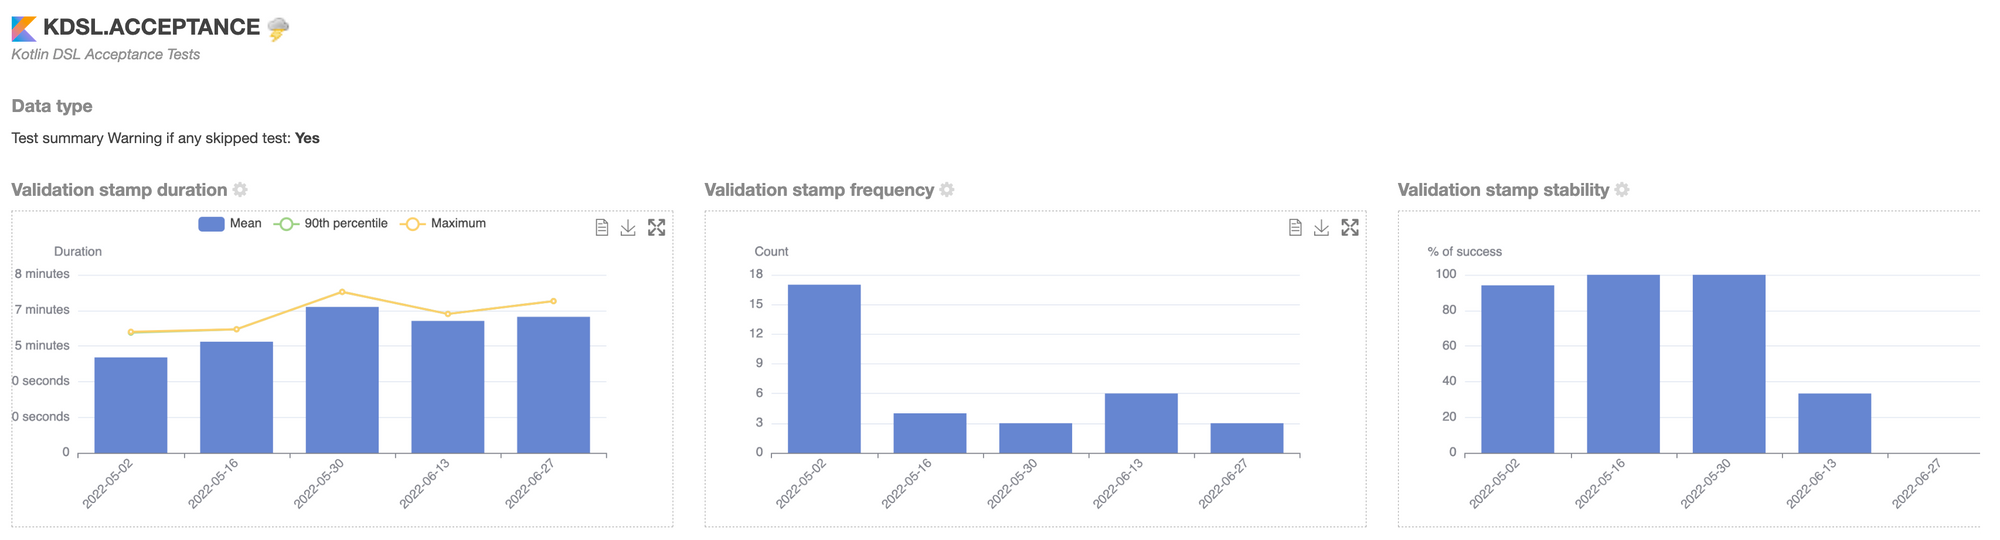
Here, three indicators:
- duration of the validation
- how often do we get a validation
- how often they are passed
All diagrams, both for promotions & validations, can be adjusted using the cog icon to select the period and the interval for these statistics.
How do you get these graphs in place in Ontrack? There is nothing to do! They are just built-in. Just focus on getting your validations & promotions injected into Ontrack, navigate to these graphs, and that's it.
You can even go further and export these metrics to external systems like InfluxDB or ElasticSearch. This way, you can have these graphs available in Kibana or Grafana if you prefer.
Additionally, the exported metrics will contain additional information spanning build relations between your pipelines, allowing the creation of metrics showing end-to-end delivery metrics between your components and your final deliverables.
For more information, I invite you to check the Ontrack documentation.